Texas’ 254 Counties Ranked by Number of Flock Cameras
Flock license plate reader cameras have rapidly spread across Texas. See all 254 counties ranked by camera count, including cameras per 10,000 residents and where they are most concentrated.
Share the post
Share this link via
Or copy link
- Texas has over 14,000 Flock cameras across 218 counties, with Harris County leading at 3,546 cameras.
- The technology has sparked privacy debates, with some agencies suspending access and others removing cameras.
- Law enforcement argues the cameras provide valuable evidence, while privacy advocates raise concerns about surveillance.
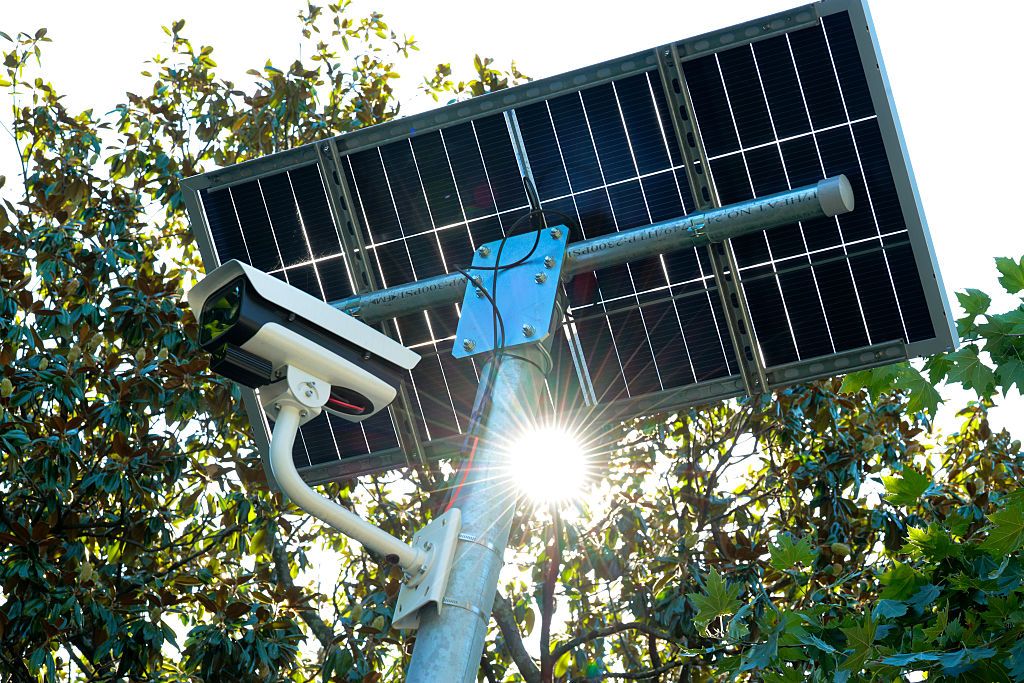
HOUSTON — Flock cameras have quietly become a fixture along roads across Texas, but exactly how common they are depends heavily on where you live.
RELATED | 15 Most Affordable Cities To Live In Texas
RELATED | 26 Oldest Cities in Texas
There’s roughly 14,001 Flock cameras across 218 of Texas’ 254 counties.
Harris County sits comfortably at the top with 3,546 cameras, followed by Dallas County with 1,334 and Tarrant County with 949.
The Texas Tribune reported in August that the Texas Department of Public Safety had data-sharing agreements with 206 county and local police agencies, up from 122 in February — a 69% increase in just five months.
Flock Safety’s automated license plate readers capture license plate images, vehicle characteristics, timestamps and camera locations.
The technology has also become the center of a growing privacy debate. The Harris County Sheriff’s Office suspended three deputies’ access to the system in August while reviewing possible misuse, while Hood County officials voted to unplug their cameras altogether.
At the same time, law enforcement agencies continue to argue the cameras can provide valuable evidence and help identify vehicles connected to crimes.
So, where are Flock cameras most prevalent in Texas?
Here’s a look at all 254 Texas counties ranked by the number of Flock cameras:
Data collected on Aug. 21, 2026 via Texas Privacy Coalition.
1. Harris County – 3,546 cameras
• 7 per 10k residents
• Most cameras in county – Houston (352)
• Population: 5,045,026
2. Dallas County – 1,334 cameras
• 5 per 10k residents
• Most cameras in county – Addison (153)
• Population: 2,661,397
3. Tarrant County – 949 cameras
• 4.2 per 10k residents
• Most cameras in county – Arlington (109)
• Population: 2,248,466
4. Fort Bend County – 906 cameras
• 9.3 per 10k residents
• Most cameras in county – Katy (259)
• Population: 975,191
5. Collin County – 603 cameras
• 4.6 per 10k residents
• Most cameras in county – Frisco (119)
• Population: 1,297,179
6. Denton County – 534 cameras
• 5 per 10k residents
• Most cameras in county – Hebron (125)
• Population: 1,069,346
7. Bexar County – 433 cameras
• 2 per 10k residents
• Most cameras in county – Shavano Park (55)
• Population: 2,160,088
8. Travis County – 430 cameras
• 3.1 per 10k residents
• Most cameras in county – Pflugerville (159)
• Population: 1,389,670
9. Montgomery County – 271 cameras
• 3.5 per 10k residents
• Most cameras in county – Conroe (54)
• Population: 781,194
10. Williamson County – 240 cameras
• 3.2 per 10k residents
• Most cameras in county – Round Rock (86)
• Population: 752,827
11. Hidalgo County – 217 cameras
• 2.4 per 10k residents
• Most cameras in county – McAllen (57)
• Population: 921,549
12. Galveston County – 214 cameras
• 5.7 per 10k residents
• Most cameras in county – Friendswood (62)
• Population: 372,207
13. Bell County – 205 cameras
• 5.1 per 10k residents
• Most cameras in county – Temple (95)
• Population: 402,248
14. Brazoria County – 193 cameras
• 4.6 per 10k residents
• Most cameras in county – Brookside Village (50)
• Population: 419,080
15. Jefferson County – 181 cameras
• 7.1 per 10k residents
• Most cameras in county – Beaumont (112)
• Population: 254,321
16. El Paso County – 175 cameras
• 2 per 10k residents
• Most cameras in county – El Paso (54)
• Population: 877,858
17. Midland County – 135 cameras
• 7.2 per 10k residents
• Most cameras in county – Midland (73)
• Population: 187,855
18. Kaufman County – 131 cameras
• 6.3 per 10k residents
• Most cameras in county – Forney (61)
• Population: 209,235
19. Webb County – 128 cameras
• 4.6 per 10k residents
• Most cameras in county – Laredo (109)
• Population: 281,224
20. Lubbock County – 122 cameras
• 3.7 per 10k residents
• Most cameras in county – Lubbock (78)
• Population: 328,906
21. Guadalupe County – 120 cameras
• 6 per 10k residents
• Most cameras in county – Cibolo (39)
• Population: 201,111
22. Brazos County – 109 cameras
• 4.4 per 10k residents
• Most cameras in county – College Station (91)
• Population: 249,088
23. Hays County – 109 cameras
• 3.6 per 10k residents
• Most cameras in county – San Marcos (35)
• Population: 304,390
24. Comal County – 100 cameras
• 4.8 per 10k residents
• Most cameras in county – New Braunfels (69)
• Population: 209,166
25. Potter County – 87 cameras
• 7.6 per 10k residents
• Most cameras in county – Amarillo (58)
• Population: 114,453
26. Ector County – 77 cameras
• 4.4 per 10k residents
• Most cameras in county – Odessa (36)
• Population: 173,801
27. Ellis County – 77 cameras
• 3.2 per 10k residents
• Most cameras in county – Midlothian (39)
• Population: 240,867
28. Smith County – 76 cameras
• 3 per 10k residents
• Most cameras in county – Tyler (40)
• Population: 252,549
29. Chambers County – 71 cameras
• 12.3 per 10k residents
• Most cameras in county – Mont Belvieu (31)
• Population: 57,594
30. Wichita County – 69 cameras
• 5.3 per 10k residents
• Most cameras in county – Wichita Falls (32)
• Population: 129,555
31. Rockwall County – 63 cameras
• 4.5 per 10k residents
• Most cameras in county – Heath (33)
• Population: 140,738
32. Randall County – 62 cameras
• 4.1 per 10k residents
• Most cameras in county – Catalpa (24)
• Population: 152,351
33. McLennan County – 62 cameras
• 2.3 per 10k residents
• Most cameras in county – Hewitt (22)
• Population: 272,020
34. Lamar County – 60 cameras
• 11.6 per 10k residents
• Most cameras in county – Paris (37)
• Population: 51,503
35. Bastrop County – 59 cameras
• 5 per 10k residents
• Most cameras in county – Bastrop (33)
• Population: 118,908
36. Johnson County – 59 cameras
• 2.7 per 10k residents
• Most cameras in county – Alvarado (13)
• Population: 218,048
37. Hunt County – 57 cameras
• 4.6 per 10k residents
• Most cameras in county – Commerce (21)
• Population: 123,336
38. Cameron County – 47 cameras
• 1.1 per 10k residents
• Most cameras in county – Cameron Park (10)
• Population: 433,946
39. Hardin County – 46 cameras
• 7.8 per 10k residents
• Most cameras in county – Rose Hill Acres (16)
• Population: 58,723
40. Orange County – 41 cameras
• 4.8 per 10k residents
• Most cameras in county – Pinehurst (20)
• Population: 86,266
41. Hopkins County – 34 cameras
• 8.7 per 10k residents
• Most cameras in county – Sulphur Springs (22)
• Population: 39,063
42. Hood County – 33 cameras
• 4.7 per 10k residents
• Most cameras in county – Granbury (29)
• Population: 70,501
43. Tom Green County – 33 cameras
• 2.7 per 10k residents
• Most cameras in county – San Angelo (27)
• Population: 120,602
44. Waller County – 32 cameras
• 4.6 per 10k residents
• Most cameras in county – Prairie View (13)
• Population: 69,858
45. Kendall County – 30 cameras
• 5.6 per 10k residents
• Most cameras in county – Boerne (20)
• Population: 53,289
46. Grayson County – 30 cameras
• 2 per 10k residents
• Most cameras in county – Sherman (11)
• Population: 153,613
47. Rusk County – 28 cameras
• 5.1 per 10k residents
• Most cameras in county – Henderson (17)
• Population: 54,854
48. Wharton County – 27 cameras
• 6.4 per 10k residents
• Most cameras in county – El Campo (11)
• Population: 42,060
49. San Patricio County – 27 cameras
• 3.8 per 10k residents
• Most cameras in county – Aransas Pass (10)
• Population: 72,053
50. Wise County – 27 cameras
• 3.2 per 10k residents
• Most cameras in county – Decatur (15)
• Population: 83,778
51. Taylor County – 27 cameras
• 1.8 per 10k residents
• Most cameras in county – Abilene (25)
• Population: 150,077
52. Nueces County – 27 cameras
• 0.8 per 10k residents
• Most cameras in county – Corpus Christi (23)
• Population: 352,992
53. Austin County – 26 cameras
• 7.7 per 10k residents
• Most cameras in county – Sealy (16)
• Population: 33,625
54. Matagorda County – 26 cameras
• 7.1 per 10k residents
• Most cameras in county – Bay City (14)
• Population: 36,463
55. Polk County – 26 cameras
• 4.9 per 10k residents
• Most cameras in county – Livingston (15)
• Population: 53,434
56. Liberty County – 25 cameras
• 2.1 per 10k residents
• Most cameras in county – Liberty (6)
• Population: 121,364
57. Walker County – 23 cameras
• 2.7 per 10k residents
• Most cameras in county – New Waverly (17)
• Population: 83,842
58. Erath County – 22 cameras
• 5 per 10k residents
• Most cameras in county – Stephenville (15)
• Population: 43,911
59. Angelina County – 22 cameras
• 2.5 per 10k residents
• Most cameras in county – Lufkin (7)
• Population: 88,154
60. Parker County – 22 cameras
• 1.2 per 10k residents
• Most cameras in county – Aledo (9)
• Population: 184,767
61. Lavaca County – 21 cameras
• 10.2 per 10k residents
• Most cameras in county – Shiner (9)
• Population: 20,651
62. Cherokee County – 21 cameras
• 3.9 per 10k residents
• Most cameras in county – Jacksonville (18)
• Population: 53,337
63. Bowie County – 21 cameras
• 2.3 per 10k residents
• Most cameras in county – Wake Village (18)
• Population: 92,696
64. Franklin County – 20 cameras
• 18.2 per 10k residents
• Most cameras in county – Mount Vernon (12)
• Population: 10,994
65. Henderson County – 20 cameras
• 2.3 per 10k residents
• Most cameras in county – Gun Barrel (11)
• Population: 88,595
66. Val Verde County – 19 cameras
• 4 per 10k residents
• Most cameras in county – Del Rio (7)
• Population: 47,835
67. Anderson County – 19 cameras
• 3.2 per 10k residents
• Most cameras in county – Palestine (18)
• Population: 59,805
68. Falls County – 18 cameras
• 10.1 per 10k residents
• Most cameras in county – Rosebud (5)
• Population: 17,869
69. Leon County – 17 cameras
• 10.1 per 10k residents
• Most cameras in county – Buffalo (5)
• Population: 16,894
70. Limestone County – 17 cameras
• 7.4 per 10k residents
• Most cameras in county – Mexia (11)
• Population: 22,849
71. Jasper County – 17 cameras
• 4.5 per 10k residents
• Most cameras in county – Jasper (13)
• Population: 33,075
72. Cooke County – 17 cameras
• 3.8 per 10k residents
• Most cameras in county – Valley View (5)
• Population: 44,461
73. Winkler County – 16 cameras
• 21.2 per 10k residents
• Most cameras in county – Kermit (8)
• Population: 7,540
74. Ward County – 15 cameras
• 13.5 per 10k residents
• Most cameras in county – Monahans (9)
• Population: 11,125
75. Victoria County – 15 cameras
• 1.6 per 10k residents
• Most cameras in county – Victoria (13)
• Population: 92,656
76. Wheeler County – 14 cameras
• 29.3 per 10k residents
• Most cameras in county – Shamrock (9)
• Population: 4,773
77. Caldwell County – 14 cameras
• 2.5 per 10k residents
• Most cameras in county – Luling (5)
• Population: 55,150
78. Medina County – 14 cameras
• 2.5 per 10k residents
• Most cameras in county – Castroville (7)
• Population: 56,881
79. Wilson County – 14 cameras
• 2.5 per 10k residents
• Most cameras in county – La Verina (5)
• Population: 56,139
80. Maverick County – 14 cameras
• 2.4 per 10k residents
• Most cameras in county – Eagle Pass (5)
• Population: 58,823
81. Harrison County – 14 cameras
• 1.9 per 10k residents
• Most cameras in county – Marshall (12)
• Population: 71,956
82. Coryell County – 14 cameras
• 1.6 per 10k residents
• Most cameras in county – Gatesville (6)
• Population: 85,592
83. Gray County – 13 cameras
• 6.2 per 10k residents
• Most cameras in county – Pampa (11)
• Population: 20,919
84. Wood County – 13 cameras
• 2.6 per 10k residents
• Most cameras in county – Winnsboro (7)
• Population: 49,688
85. Navarro County – 13 cameras
• 2.3 per 10k residents
• Most cameras in county – Corsicana (8)
• Population: 57,181
86. Scurry County – 12 cameras
• 7.4 per 10k residents
• Most cameras in county – Snyder (11)
• Population: 16,162
87. Aransas County – 12 cameras
• 4.6 per 10k residents
• Most cameras in county – Rockport (5)
• Population: 26,146
88. Kerr County – 12 cameras
• 2.2 per 10k residents
• Most cameras in county – Kerrville (7)
• Population: 54,037
89. Gregg County – 12 cameras
• 1 per 10k residents
• Most cameras in county – Longview (6)
• Population: 126,095
90. Hudspeth County – 11 cameras
• 32 per 10k residents
• Most cameras in county – Sierra Blanca (8)
• Population: 3,433
91. Swisher County – 11 cameras
• 16.4 per 10k residents
• Most cameras in county – Tulia (7)
• Population: 6,703
92. Yoakum County – 11 cameras
• 14.8 per 10k residents
• Most cameras in county – Plains (8)
• Population: 7,438
93. Jack County – 11 cameras
• 11.5 per 10k residents
• Most cameras in county – Jacksboro (7)
• Population: 9,563
94. Rains County – 11 cameras
• 8.1 per 10k residents
• Most cameras in county – Emory (4)
• Population: 13,542
95. Panola County – 11 cameras
• 4.8 per 10k residents
• Most cameras in county – Beckville (4)
• Population: 23,018
96. Kleberg County – 11 cameras
• 3.5 per 10k residents
• Most cameras in county – Kingsville (7)
• Population: 30,315
97. Hill County – 11 cameras
• 2.8 per 10k residents
• Most cameras in county – Hillsboro (5)
• Population: 39,503
98. Burnet County – 11 cameras
• 1.9 per 10k residents
• Most cameras in county – Marble Falls (8)
• Population: 57,015
99. Trinity County – 10 cameras
• 7 per 10k residents
• Most cameras in county – Groveton (5)
• Population: 14,384
100. Bosque County – 10 cameras
• 5.3 per 10k residents
• Most cameras in county – Valley Mills (4)
• Population: 18,918
101. Moore County – 10 cameras
• 4.6 per 10k residents
• Most cameras in county – Dumas (8)
• Population: 21,891
102. Nacogdoches County – 10 cameras
• 1.5 per 10k residents
• Most cameras in county – Nacogdoches (6)
• Population: 66,035
103. Carson County – 9 cameras
• 15.5 per 10k residents
• Most cameras in county – White Deer (3)
• Population: 5,805
104. Reeves County – 9 cameras
• 7.4 per 10k residents
• Most cameras in county – Balmorhea (3)
• Population: 12,138
105. DeWitt County – 9 cameras
• 4.4 per 10k residents
• Most cameras in county – Cuero (8)
• Population: 20,309
106. Shelby County – 9 cameras
• 3.7 per 10k residents
• Most cameras in county – Center (3)
• Population: 24,286
107. Uvalde County – 9 cameras
• 3.6 per 10k residents
• Most cameras in county – Uvalde (4)
• Population: 24,963
108. Culberson County – 8 cameras
• 35.3 per 10k residents
• Most cameras in county – N/A
• Population: 2,267
109. Martin County – 8 cameras
• 15.1 per 10k residents
• Most cameras in county – Lenorah (8)
• Population: 5,284
110. Presidio County – 8 cameras
• 14.7 per 10k residents
• Most cameras in county – Presidio (6)
• Population: 5,433
111. Zapata County – 8 cameras
• 5.8 per 10k residents
• Most cameras in county – Falcon (3)
• Population: 13,753
112. Pecos County – 8 cameras
• 5.5 per 10k residents
• Most cameras in county – Fort Stockton (4)
• Population: 14,560
113. Bandera County – 8 cameras
• 3.5 per 10k residents
• Most cameras in county – Bandera (5)
• Population: 22,876
114. Terrell County – 7 cameras
• 99.7 per 10k residents
• Most cameras in county – Sanderson (5)
• Population: 702
115. Armstrong County – 7 cameras
• 38 per 10k residents
• Most cameras in county – Washburn (6)
• Population: 1,843
116. Montague County – 7 cameras
• 3.2 per 10k residents
• Most cameras in county – Nocona (2)
• Population: 21,966
117. Houston County – 7 cameras
• 3.1 per 10k residents
• Most cameras in county – Crockett (5)
• Population: 22,316
118. Gillespie County – 7 cameras
• 2.5 per 10k residents
• Most cameras in county – Fredericksburg (5)
• Population: 28,527
119. Hale County – 7 cameras
• 2.2 per 10k residents
• Most cameras in county – Abernathy (2)
• Population: 31,819
120. Washington County – 7 cameras
• 1.8 per 10k residents
• Most cameras in county – Brenham (6)
• Population: 38,288
121. Lipscomb County – 6 cameras
• 20.3 per 10k residents
• Most cameras in county – Booker (3)
• Population: 2,955
122. Sutton County – 6 cameras
• 18.7 per 10k residents
• Most cameras in county – Sonora (6)
• Population: 3,203
123. Kimble County – 6 cameras
• 13.5 per 10k residents
• Most cameras in county – Junction (6)
• Population: 4,438
124. Refugio County – 6 cameras
• 9 per 10k residents
• Most cameras in county – Tivoli (4)
• Population: 6,657
125. McCulloch County – 6 cameras
• 8 per 10k residents
• Most cameras in county – Brady (4)
• Population: 7,472
126. Dawson County – 6 cameras
• 5.1 per 10k residents
• Most cameras in county – Lamesa (5)
• Population: 11,776
127. Hutchinson County – 6 cameras
• 3.1 per 10k residents
• Most cameras in county – Borger (5)
• Population: 19,633
128. Calhoun County – 6 cameras
• 3.1 per 10k residents
• Most cameras in county – Port Lavaca (3)
• Population: 19,599
129. Tyler County – 6 cameras
• 2.9 per 10k residents
• Most cameras in county – Woodville (4)
• Population: 20,443
130. Titus County – 6 cameras
• 1.9 per 10k residents
• Most cameras in county – Mount Pleasant (3)
• Population: 31,563
131. Grimes County – 6 cameras
• 1.8 per 10k residents
• Most cameras in county – Todd Mission (4)
• Population: 34,252
132. Bee County – 6 cameras
• 1.8 per 10k residents
• Most cameras in county – Beeville (5)
• Population: 32,515
133. Van Zandt County – 6 cameras
• 0.9 per 10k residents
• Most cameras in county – Van (4)
• Population: 66,130
134. Starr County – 6 cameras
• 0.9 per 10k residents
• Most cameras in county – Rio Grande City (2)
• Population: 66,319
135. Reagan County – 5 cameras
• 15.8 per 10k residents
• Most cameras in county – Stiles (4)
• Population: 3,166
136. Coke County – 5 cameras
• 14.7 per 10k residents
• Most cameras in county – Bronte (2)
• Population: 3,412
137. Baylor County – 5 cameras
• 14.4 per 10k residents
• Most cameras in county – Seymour (2)
• Population: 3,472
138. Sherman County – 5 cameras
• 7.2 per 10k residents
• Most cameras in county – Stratford (3)
• Population: 2,781
139. Dallam County – 5 cameras
• 6.7 per 10k residents
• Most cameras in county – Dalhart (2)
• Population: 7,508
140. San Augustine County – 5 cameras
• 6.5 per 10k residents
• Most cameras in county – San Augustine (4)
• Population: 7,722
141. Colorado County – 5 cameras
• 2.3 per 10k residents
• Most cameras in county – Columbus (1)
• Population: 21,439
142. Gaines County – 5 cameras
• 2.1 per 10k residents
• Most cameras in county – State Line (3)
• Population: 23,956
143. Lampasas County – 5 cameras
• 2.1 per 10k residents
• Most cameras in county – Lampasas (4)
• Population: 23,657
144. Llano County – 5 cameras
• 2.1 per 10k residents
• Most cameras in county – Llano (2)
• Population: 23,353
145. Palo Pinto County – 5 cameras
• 1.6 per 10k residents
• Most cameras in county – Santo (2)
• Population: 30,791
146. Fannin County – 5 cameras
• 1.3 per 10k residents
• Most cameras in county – Bonham (2)
• Population: 39,265
147. Atascosa County – 5 cameras
• 0.9 per 10k residents
• Most cameras in county – Leming (2)
• Population: 53,590
148. Kenedy County – 4 cameras
• 125.4 per 10k residents
• Most cameras in county – South Padre Island (2)
• Population: 319
149. Sterling County – 4 cameras
• 29.7 per 10k residents
• Most cameras in county – Sterling City (4)
• Population: 1,349
150. Real County – 4 cameras
• 14.6 per 10k residents
• Most cameras in county – Leakey (2)
• Population: 2,745
151. Crockett County – 4 cameras
• 14.4 per 10k residents
• Most cameras in county – Ozona (3)
• Population: 2,769
152. Donley County – 4 cameras
• 12.4 per 10k residents
• Most cameras in county – Clarendon (2)
• Population: 3,213
153. Ochiltree County – 4 cameras
• 4.3 per 10k residents
• Most cameras in county – Perryton (3)
• Population: 9,284
154. Brewster County – 4 cameras
• 4.2 per 10k residents
• Most cameras in county – Alpine (2)
• Population: 9,458
155. Clay County – 4 cameras
• 3.7 per 10k residents
• Most cameras in county – Byers (2)
• Population: 10,764
156. Live Oak County – 4 cameras
• 3.4 per 10k residents
• Most cameras in county – George West (2)
• Population: 11,929
157. Madison County – 4 cameras
• 2.8 per 10k residents
• Most cameras in county – Madisonville (2)
• Population: 14,226
158. Karnes County – 4 cameras
• 2.7 per 10k residents
• Most cameras in county – Falls City (2)
• Population: 15,018
159. Lee County – 4 cameras
• 2.1 per 10k residents
• Most cameras in county – Dime Box (1)
• Population: 18,729
160. Fayette County – 4 cameras
• 1.6 per 10k residents
• Most cameras in county – La Grange (3)
• Population: 25,459
161. Cass County – 4 cameras
• 1.4 per 10k residents
• Most cameras in county – Atlanta (2)
• Population: 28,651
162. Loving County – 3 cameras
• 576.9 per 10k residents
• Most cameras in county – Mentone (3)
• Population: 52
163. Irion County – 3 cameras
• 20.5 per 10k residents
• Most cameras in county – Barnhart (2)
• Population: 1,463
164. Upton County – 3 cameras
• 9.6 per 10k residents
• Most cameras in county – McCamey (1)
• Population: 3,131
165. Crane County – 3 cameras
• 6.6 per 10k residents
• Most cameras in county – N/A
• Population: 4,554
166. Mills County – 3 cameras
• 6.6 per 10k residents
• Most cameras in county – Goldthwaite (3)
• Population: 4,580
167. Jim Hogg County – 3 cameras
• 6.6 per 10k residents
• Most cameras in county – Hebbronville (3)
• Population: 4,555
168. Hartley County – 3 cameras
• 6.1 per 10k residents
• Most cameras in county – Channing (1)
• Population: 4,904
169. Lynn County – 3 cameras
• 5 per 10k residents
• Most cameras in county – New Home (2)
• Population: 6,017
170. Goliad County – 3 cameras
• 4.2 per 10k residents
• Most cameras in county – Goliad (3)
• Population: 7,208
171. Dimmit County – 3 cameras
• 3.7 per 10k residents
• Most cameras in county – Carrizo Springs (3)
• Population: 8,024
172. Hamilton County – 3 cameras
• 3.5 per 10k residents
• Most cameras in county – Hamilton (2)
• Population: 8,680
173. Archer County – 3 cameras
• 3.3 per 10k residents
• Most cameras in county – Lakeside City (2)
• Population: 9,129
174. Terry County – 3 cameras
• 2.6 per 10k residents
• Most cameras in county – Brownfield (3)
• Population: 11,720
175. Gonzales County – 3 cameras
• 1.5 per 10k residents
• Most cameras in county – Gonzales (2)
• Population: 20,159
176. Howard County – 3 cameras
• 1 per 10k residents
• Most cameras in county – Big Spring (3)
• Population: 30,504
177. Jim Wells County – 3 cameras
• 0.8 per 10k residents
• Most cameras in county – Alice (1)
• Population: 38,804
178. McMullen County – 2 cameras
• 36.8 per 10k residents
• Most cameras in county – Tilden (2)
• Population: 544
179. Motley County – 2 cameras
• 19.2 per 10k residents
• Most cameras in county – Roaring Springs (2)
• Population: 1,043
180. Glasscock County – 2 cameras
• 17.7 per 10k residents
• Most cameras in county – Garden City (2)
• Population: 1,128
181. Dickens County – 2 cameras
• 11.8 per 10k residents
• Most cameras in county – Spur (1)
• Population: 1,692
182. Oldham County – 2 cameras
• 11.2 per 10k residents
• Most cameras in county – Adrian (2)
• Population: 1,783
183. Cochran County – 2 cameras
• 7.9 per 10k residents
• Most cameras in county – Bledsoe (2)
• Population: 2,546
184. Hemphill County – 2 cameras
• 6.5 per 10k residents
• Most cameras in county – N/A
• Population: 3,083
185. Concho County – 2 cameras
• 5.5 per 10k residents
• Most cameras in county – Eden (2)
• Population: 3,607
186. San Saba County – 2 cameras
• 3.5 per 10k residents
• Most cameras in county – Richland Springs (1)
• Population: 5,787
187. Brooks County – 2 cameras
• 3 per 10k residents
• Most cameras in county – Encino (2)
• Population: 6,579
188. Bailey County – 2 cameras
• 2.9 per 10k residents
• Most cameras in county – Muleshoe (2)
• Population: 6,963
189. Coleman County – 2 cameras
• 2.5 per 10k residents
• Most cameras in county – Santa Anna (2)
• Population: 7,915
190. Sabine County – 2 cameras
• 2 per 10k residents
• Most cameras in county – Hemphill (1)
• Population: 10,012
191. Red River County – 2 cameras
• 1.7 per 10k residents
• Most cameras in county – Avery (2)
• Population: 11,816
192. Wilbarger County – 2 cameras
• 1.6 per 10k residents
• Most cameras in county – N/A
• Population: 12,481
193. Nolan County – 2 cameras
• 1.4 per 10k residents
• Most cameras in county – Blackwell (1)
• Population: 14,117
194. Callahan County – 2 cameras
• 1.4 per 10k residents
• Most cameras in county – Baird (1)
• Population: 14,491
195. Jackson County – 2 cameras
• 1.3 per 10k residents
• Most cameras in county – Ganado (2)
• Population: 15393
196. Deaf Smith County – 2 cameras
• 1.1 per 10k residents
• Most cameras in county – Hereford (2)
• Population: 18,626
197. Eastland County – 2 cameras
• 1.1 per 10k residents
• Most cameras in county – Gorman (1)
• Population: 18,143
198. Burleson County – 2 cameras
• 1 per 10k residents
• Most cameras in county – Caldwell (1)
• Population: 20,549
199. Milam County – 2 cameras
• 0.8 per 10k residents
• Most cameras in county – Praesel (1)
• Population: 26,258
200. Brown County – 2 cameras
• 0.5 per 10k residents
• Most cameras in county – Brownwood (2)
• Population: 38,711
201. Borden County – 1 camera
• 17.6 per 10k residents
• Most cameras in county – Gail (1)
• Population: 567
202. Foard County – 1 camera
• 9.6 per 10k residents
• Most cameras in county – Crowell (1)
• Population: 1,044
203. Mason County – 1 camera
• 2.5 per 10k residents
• Most cameras in county – Mason (1)
• Population: 3,990
204. Garza County – 1 camera
• 2.2 per 10k residents
• Most cameras in county – N/A
• Population: 4,510
205. Delta County – 1 camera
• 1.8 per 10k residents
• Most cameras in county – Enloe (1)
• Population: 5,549
206. Childress County – 1 camera
• 1.5 per 10k residents
• Most cameras in county – Childress (1)
• Population: 6,643
207. Zavala County – 1 camera
• 1.1 per 10k residents
• Most cameras in county – La Pryor (1)
• Population: 9,037
208. Marion County – 1 camera
• 1 per 10k residents
• Most cameras in county – Jefferson (1)
• Population: 9,896
209. Runnels County – 1 camera
• 1 per 10k residents
• Most cameras in county – Miles (1)
• Population: 9,693
210. Blanco County – 1 camera
• 0.7 per 10k residents
• Most cameras in county – Johnson City (1)
• Population: 13,581
211. Robertson County – 1 camera
• 0.6 per 10k residents
• Most cameras in county – N/A
• Population: 17,839
212. Hockley County – 1 camera
• 0.5 per 10k residents
• Most cameras in county – Opdyke West (1)
• Population: 21,600
213. Jones County – 1 camera
• 0.5 per 10k residents
• Most cameras in county – Hawley (1)
• Population: 20,861
214. Andrews County – 1 camera
• 0.5 per 10k residents
• Most cameras in county – N/A
• Population: 18,914
215. Freestone County – 1 camera
• 0.5 per 10k residents
• Most cameras in county – N/A
• Population: 20,811
216. Willacy County – 1 camera
• 0.5 per 10k residents
• Most cameras in county – Raymondville (1)
• Population: 19,971
217. San Jacinto County – 1 camera
• 0.3 per 10k residents
• Most cameras in county – Coldspring (1)
• Population: 29,488
218. Upshur County – 1 camera
• 0.2 per 10k residents
• Most cameras in county – Big Sandy (1)
• Population: 44,410
Counties With 0 Flock Cameras
• Briscoe County
• Camp County
• Castro County
• Collingsworth County
• Comanche County
• Cottle County
• Crosby County
• Duval County
• Edwards County
• Fisher County
• Floyd County
• Frio County
• Hall County
• Hansford County
• Hardeman County
• Haskell County
• Jeff Davis County
• Kent County
• King County
• Kinney County
• Knox County
• La Salle County
• Lamb County
• Menard County
• Mitchell County
• Morris County
• Newton County
• Parmer County
• Roberts County
• Schleicher County
• Shackelford County
• Somervell County
• Stephens County
• Stonewall County
• Throckmorton County
• Young County
Related Tags
Bastrop Bexar County Corpus Christi El Paso Fort Bend County Friendswood Galveston County Harris County Houston Katy Laredo Lubbock Midland Nacogdoches New Braunfels South Padre Island Texas